2. Environmental indicators
The Inditex system of indicators shows the measurable results of our environmental commitments in terms of natural resources and energy consumption, waste generation and atmospheric emissions. These indicators are expressed in absolute and relative data according to the number of garments released on the market, reflecting the efficiency of all areas of the company. These relative indicators show that greenhouse gas (GHG) emissions have been significantly reduced, a reflection of the successful integration of innovative environmental management into all phases of the business. The scope of the indicators includes Inditex’s own premises:
- Headquarters and all brand head offices: Zara, Pull&Bear, Massimo Dutti, Bershka, Stradivarius, Oysho, Zara Home, Uterqüe and Tempe, all located in Spain.
- All the Group’s factories, all located in Spain.
- All the Group’s logistics centres.
- All of the Group’s own stores and franchises throughout the world.
International offices are not included within this scope. Those indicators for which the scope differs will be described along with the data in question.
To calculate GHG emissions, we follow the recommendations of the Intergovernmental Panel on Climate Change, IPCC (Guidelines for National Greenhouse Gas Inventories, 2007) and the World Resources Institute GHG Protocol (2008). The emissions factors used are as follows:
- Natural gas: 0.2025 kg CO2eq/kWh
- Diesel: 2.6919 kg CO2eq/litre
The emission factors applied to natural gas and diesel are taken from the GHG Protocol for Stationary Combustion v.4.0 by the World Resources Institute (WRI). Emissions from electricity consumption have been calculated using the emissions factor corresponding to the electricity mix of each of the 88 countries in which Inditex operates. The database used corresponds to the GHG Protocol tool for stationary combustion. Version 4.5 (World Resources Institute (WRI), 2014).
Therefore, the conversion factors used to calculate energy consumption are:
- 1 tonne of oil equivalent (toe) = 41.868 GJ
- 103 m3 natural gas = 0.9315 tep
- 1 tonne diesel = 1.035 toe
- Oil density = 0.832 kg/litre at 15°C (Joint Research Centre, 2007).
Relative indicators are calculated according to the following formula:
Ratio = (absolute value of the year/number of garments released on the market during the year) x 1000.

* Includes all product units released on the market through all the stores, both owned and franchised.
The environmental indicator system includes data collected from 1 February 2014 to 31 January 2015.
Energy consumption
Overall energy consumption of Inditex Group facilities, expressed in terajoules (TJ), comes from the use of fossil fuels (natural gas, propane and diesel) and electricity from the grid. This includes energy consumption in all factories, head office, branch offices, logistics centres and own stores.
The increase in the commercial surface and the extension of the logistical capacity have determined the growth of the Inditex energy consumption. However, the energy growth has been 4.3% below the growth of the commercial surface, which is 10%.
This year the consumption of gas natural and diesel continues to decrease. These reductions are mainly due to a decrease in the activity of trigeneration plants. Diesel consumption continues to decline due to the change to natural gas boilers. As result of this decrease, the SO2, CO and NOX emissions associated with this fuel also decrease.
Although the total electricity consumption increases, it is particularly relevant that the electricity consumption of stores per item placed on the market has decreased by 2.3%.


Consumption of natural gas continues its downward trend due to the continuous optimization of industrial processes. Also this year there have been maintenance operations of cogeneration equipments.
The diesel continues showing a decrease due to the replacement of diesel boilers. As a result of this reduction, SO2, CO and NOX emissions associated with this fuel has also decreased.
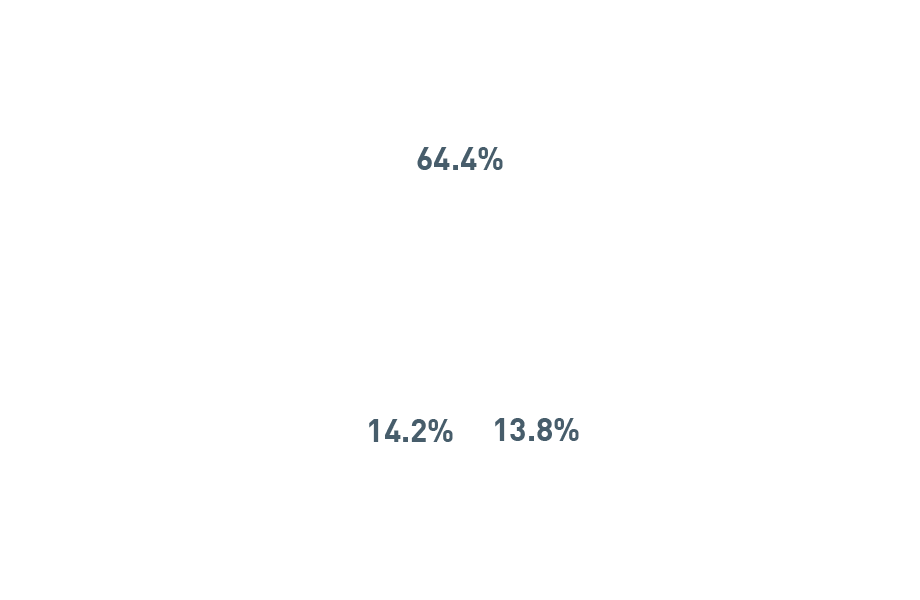
The company’s energy consumption scheme permits the combination of different energy sources, including renewable energies. The trigeneration plants, heating and process boilers, solar panels and wind generators account for 42.15% of electric consumed at head offices and factories. In addition to this generation, our own stores in Germany consume from 2013 energy coming from renewable sources.

Own logistic centres, own head offices and own factories
Our facilities are designed for the construction and maintenance to comply with the requirements of sustainable architecture and to guarantee efficient use of the natural resources.
Thanks to the eco-efficiency measures of the Group, the consumption of electricity per meter squared continues to reduce despite the increased surface of our facilities. During this year, the offices of Arteixo almost doubled in size and the surface of the logistics centres grew by 13%.
Own Stores
Electricity consumption at stores is without doubt very high. Therefore, a great deal of effort has been made to continue improving the eco-efficient store model. This effort is reflected in the 2.3% decrease in electrical energy consumption per item placed on the market. Inditex uses a new platform to centrally monitor generated consumption as well as to control the efficiency of heating and cooling systems and electricity in 1,234 eco-efficient stores across 30 countries. The collection of real monitored data has allowed the company to recalculate the environmental parameters associated with its stores.
*The total and relative electrical consumption data is not comparable to previous years due to the real consumption values obtained from the monitoring platform. To estimate the average consumption, of the 1,234 stores monitored, data has been considered from 427 stores, with 100% of the same being eco-efficient. Although currently only 51% of the total number of Inditex stores are eco-efficient, our objective is to reach 100% by 2020.
Inditex Greenhouse Gas (GHG) Emissions
The Group’s greenhouse gas (GHG) emissions are calculated and reported in line with the international directives of the Intergovernmental Panel on Climate Change, IPCC (Guidelines for National Greenhouse Gas Inventories, 2007) and the World Resources Institute (GHG Protocol, 2008). Emissions from electricity consumption have been calculated using the emissions factor corresponding to the electricity mix of each of the 88 countries in which Inditex operates. The database used corresponds to the GHG Protocol tool for stationary combustion. Version 4.5 (World Resources Institute (WRI), 2014). The Inditex Group’s GHG emissions inventory includes direct and indirect emissions for the period 1 February 2014 to 31 January 2015.
A data history based on each of the scopes considered by the GHG Protocol is presented below.
Emissions scopes 1 and 2
- Scope 1: Direct emissions. These are GHG emissions associated with sources under the Inditex Group’s control. It includes:
- Emissions associated with electricity and heat generation in owned premises, detailed at the beginning of the section. Emissions associated with occasional leaks (or isolated leaks) of HFC and PFC gases from air-conditioning equipment are not included.
- Emissions from the use of own vehicles.
- Scope 2: Indirect emissions. Emissions associated with the generation of electricity or thermal energy the Inditex Group buys. The calculation was based on the GHG emissions from all the Group’s facilities, as defined at the beginning of the section. Electricity used in international offices not included. Due to the monitoring of consumption in our premises across the world, this year we have modified the calculation methodology, incorporating the emission factor corresponding to the country where our operations are located.
| 2011 | 2012 | 2013 | 2014 | |
|---|---|---|---|---|
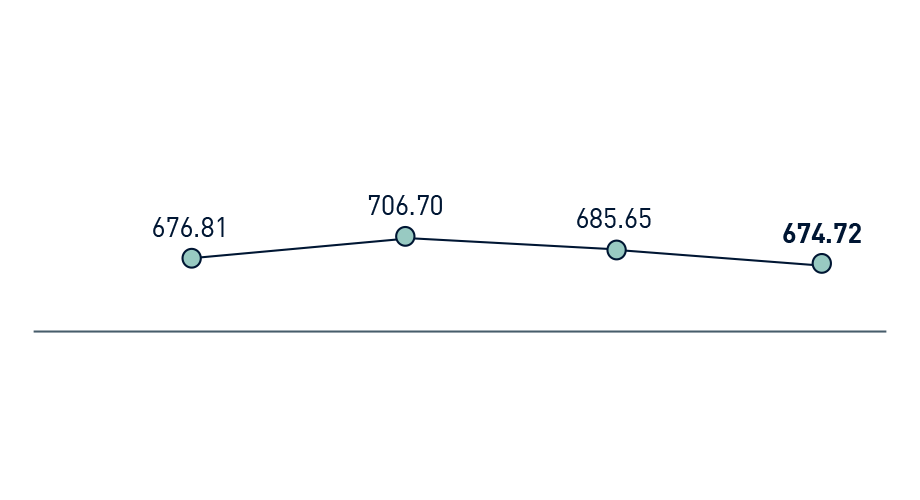
| Scope 1 (t CO2eq) | 21,919 | 24,479 | 22,525 | 21,347 |
| Scope 2 (t CO2eq)* | 543,574 | 589,758 | 627,982 | 666,188 |
| Number of garments released on the market | 835,524,467 | 869,167,058 | 948,745,988 | 1,018,995,911 |
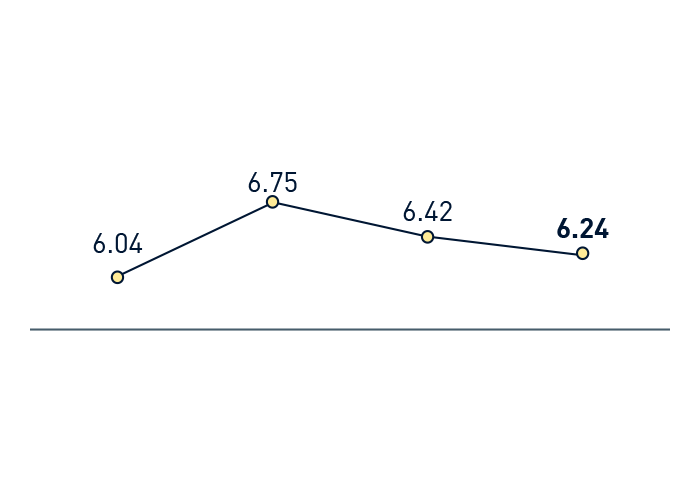
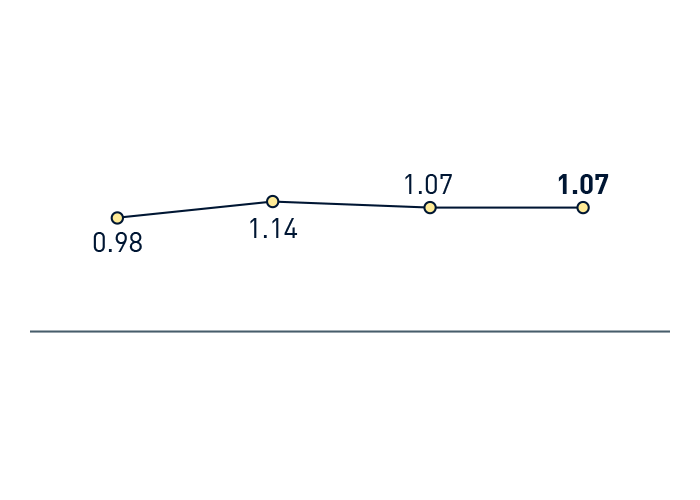
| g CO2eq per garment released on the market** | 676.81 | 706.70 | 685.65 | 674.72 |
*Scope 2 emissions are not comparable with previous years as the calculation method has been modified as explained in the previous section.
**The efficiency ratio includes emissions associated with the Group’s operations (scope 1 and 2).
Emissions scope 3
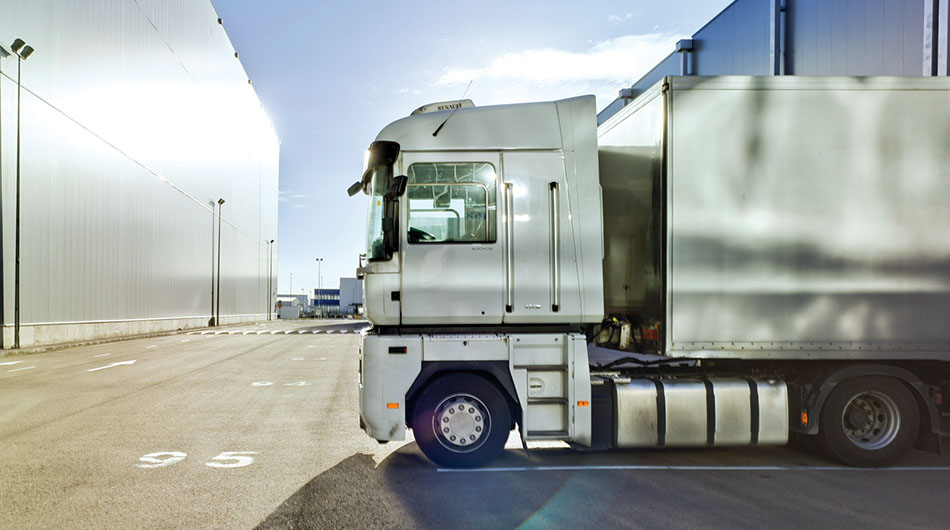
- Scope 3: Optional scope that includes indirect emissions associated with the goods and services supply chain produced outside the organization. Included are emissions from the transport of products from our logistics centres to stores (downstream) performed by external logistics operators (air, land and sea transport) as well as the emissions associated with electricity consumption in franchise stores.
We calculate the GHG resulting from distribution and logistics operations carried out by external logistics operators based on the vehicles used to transport the product (Scope 3). This year, we have modified the calculation methodology for the emissions associated to our franchised stores all over the world, and thanks to the establishment of the monitoring platform, we have been able to calculate emissions incorporating the emission factor corresponding to the energy mix of each country.
| 2011 | 2012 | 2013 | 2014 | |
|---|---|---|---|---|
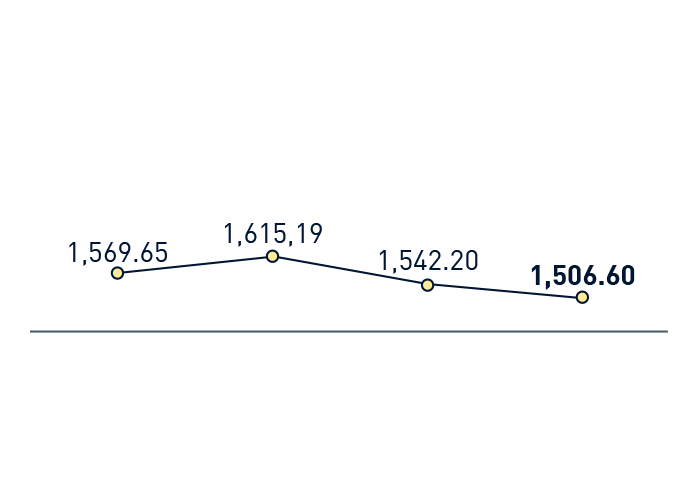
| Scope 3 - Downstream Transport (t CO2eq) | 332,097 | 398,158 | 462,120 | 596,316 |
| Scope 3 - Franchised store (t CO2eq)* | 94,074 | 100,143 | 108,035 | 113,094 |
*Additional emissions (scope 3) from franchise stores are not comparable to previous years due to the modification of the calculation method explained in the previous section.
The transport calculation has been carried out based on the weight of the product sent and the number of kilometres travelled by each means. The following emission factors, as proposed by the GHG Protocol, are used:
- Kg of CO2/km truck (load 3.5 - 33 t)= 0.8678
- Kg of CH4/km truck (load 3.5 - 33 t)= 2.3983*10-5
- Kg of N2O/km truck (load 3.5 - 33 t)= 1.85012*10-5
- Kg of CO2/tonne and km of short haul flight (<463Km)= 1.96073
- Kg of CH4/tonne and km of short haul flight (<463Km)= 2.8574*10-5
- Kg of N2O/tonne and km of short haul flight (<463Km)= 3.2823*10-5
- Kg. of CO2/tonne and km of medium haul flight (between 463 and 1108Km)= 1.47389
- Kg of CH4/tonne and km of medium haul flight (between 463 and 1108Km)= 2.8574*10-5
- Kg of N2O/tonne and km of medium haul flight (between 463 and 1108Km)= 3.2823*10-5
- Kg of CO2/tonne and km of long haul flight (>1108Km)= 0.61324
- Kg of CH4/tonne and km of long haul flight (>1108Km)= 2.8574*10-5
- Kg of N2O/tonne and km of long haul flight (>1108Km)= 3.2823*10-5
- Kg of CO2/tonne and km ship= 0.0079
- Kg of CH4/tonelada tonne and km ship = 2.8094*10-6
- Kg of N2O/tonne and km ship = 9.5932*10-7
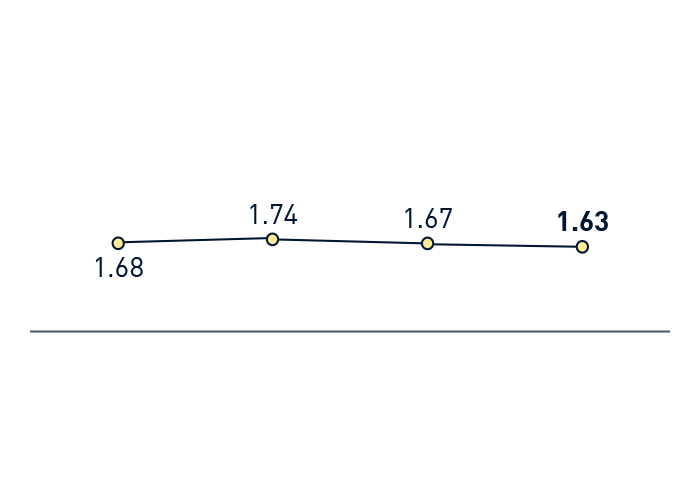
The construction of logistics centres with LEED certification, adequate energy management and optimization of processes permits us to reduce GHG emissions per item by 1.6%.
Other atmospheric emissions
All the focuses of emissions of the Inditex Group are submitted to periodic controls by an authorized inspection authority and have been found to be within the parameters set out in the legislation in force. The following is the annual evolution of other atmospheric emissions associated with the emissions focus of the Groups’s headquarters, all Inditex factories, brand head offices and logistics centres.


*2014 data does not include emissions of Cabanillas logistics platform since measurements have not yet been performed since its opening.
Waste Minimisation Plan
Thanks to the Waste Minimisation Plan and the efforts and commitment of all employees, since 2005 we have reduced the amount of waste generated per garment released in the market. Waste generation data refers to the waste generated in headquarters, brand head offices, all Inditex factories and logistics centres. It does not include the waste generated in stores.
Evolution of recovered products to send to recycling (Kg)
The increase in waste generation is due to the expansion of logistics capacity of the Group, in addition to the maintenance of current and improved source separation processes. All waste generated by Inditex is collected and managed by a legally authorised body that sends the waste for recycling (in the case of paper), for composting or processing (wood, plastics), or to be managed in an environmentally-friendly way.
All waste generated by Inditex is collected and managed by legally authorised companies that will send the waste for recycling (in the case of paper) for composting or processing (wood, plastics) or will be managed in a way not prejudicial to the environment.

Annual generation of urban waste or similar
This waste is classified in accordance with the European Waste Catalogue (EWC) and its transposition into national and regional legislation.

Use of reusable alarms
The reusable alarm system introduced in 2011 has made it possible to completely eliminate the use of single-use alarms, making it possible to recirculate 672,377,823 alarms in 2014 In addition to financial savings, this initiative provides an important environmental benefit, since reuse reduces the natural resource consumption and atmospheric emissions associated with security tag manufacture and recycling.
Evolution of principal hazardous waste
In 2014, thanks to the actions in the field of waste management, we have improved the work in source separation and its subsequent delivery to authorized agent.
The peaks observed are due to the tasks of preventive maintenance for the proper operation of our facilities.


Destination of waste according to type and treatment
As part of the final stage of Inditex’s Waste Minimisation Plan, all waste generated by the company is collected and managed by a legally authorised body that sends the waste for recycling (in the case of paper), for composting or processing (wood, plastics), or to be managed in an environmentally-friendly way.
The packaging materials released on the market (paper and plastic bags, labels, protective elements) along with the products sold by Inditex are adequately managed by authorized bodies. Inditex subscribes to the Integrated Management Systems for Packaging and Wrapping available in countries that employ them. The company’s commitment to these systems means that each Inditex brand pays a non-profit management agency to collect and manage the waste generated by the stores. This management agency is established with the recognition of the authorities of each country (Ecoembes in Spain) to ensure that the waste generated by stores is collected, managed and recycled correctly.
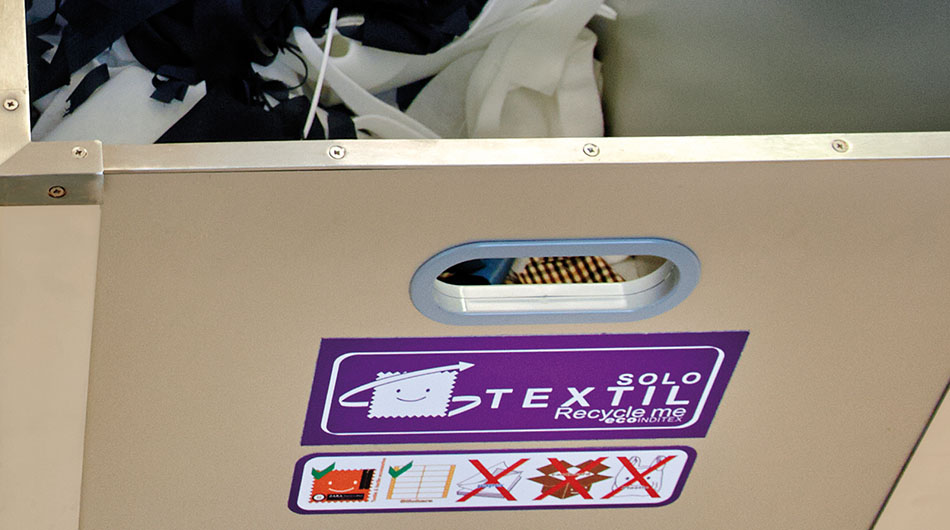
In terms of the recovery of products released on the market, it is not viable to assess the volume generated nor its management on a worldwide level, given that there is no specific collection or management system for textile materials on the global level.
Water consumption in own offices, own Inditex’s factories, own logistics centers and own stores
Data on water consumption comes from direct measurements and those received from suppliers (public water suppliers), offices, all Inditex’s factories, logistics centres and own stores.
The increased water consumption in 2014 compared to previous years is mainly a result of the opening of new stores and the Group's increased logistic capacity.
Water supplied to all the centres for use both in processes and for consumption comes from public, authorised supply networks. Inditex has no impact on protected habitats.
Most of the water consumption is accounted for domestic use – cleaning and sanitation – and its discharge to municipal sewage systems is guaranteed.
In the area of industrial activities, water is mainly required for steam generation and industrial refrigeration in a closed cycle, where recirculation systems are used. Discharge of waste water from all installations was carried out via sanitation networks, in all cases with the corresponding administrative authorization. This requires periodic analyses to guarantee compliance with the law in force. The amount of wastewater can be calculated as equal to water consumed, as there are no productive processes that consume water and the cooling systems use a closed cycle.