Social indicators
Code of Conduct compliance programme of manufacturers and suppliers
Pre-assessment audits by country
| Country | No. of audits | % approved |
|---|---|---|
| Bangladesh | 4 | 75% |
| Brazil | 2 | 100% |
| Cambodia | 6 | 66.67% |
| China | 31 | 54.84% |
| India | 9 | 22.22% |
| Indonesia | 2 | 50% |
| Mauritius | 1 | 100% |
| Morocco | 5 | 40% |
| Pakistan | 1 | 100% |
| Portugal | 28 | 53.57% |
| Romania | 2 | 100% |
| Tunisia | 1 | 100% |
| Turkey | 17 | 35.29% |
| Vietnam | 4 | 100% |
| TOTAL | 113 | 53.98% |
Audits by country
| Country | Type of audit | |||
|---|---|---|---|---|
|
|
Initial | Follow-up | Special* | General t. |
| Argentina | 17 | 6 | 88 | 111 |
| Bangladesh | 174 | 46 | 36 | 256 |
| Brazil | 129 | 238 | 367 | |
| Bulgaria | 12 | 12 | ||
| Cambodia | 3 | 3 | ||
| China | 608 | 205 | 165 | 978 |
| Egypt | 3 | 2 | 5 | |
| India | 33 | 12 | 4 | 49 |
| Indonesia | 156 | 54 | 52 | 262 |
| Italy | 23 | 7 | 6 | 36 |
| Lithuania | 4 | 4 | ||
| Mexico | 1 | 1 | ||
| Morocco | 35 | 61 | 97 | 193 |
| Pakistan | 12 | 12 | ||
| Portugal | 3 | 1 | 1 | 5 |
| Romania | 220 | 94 | 35 | 349 |
| Spain | 31 | 1 | 1 | 33 |
| Sri lanka | 2 | 2 | ||
| Thailand | 2 | 1 | 3 | |
| Tunisia | 18 | 3 | 4 | 25 |
| Turkey | 478 | 101 | 154 | 733 |
| Vietnam | 49 | 15 | 10 | 74 |
| GENERAL TOTAL | 2.013 | 608 | 892 | 3.513 |
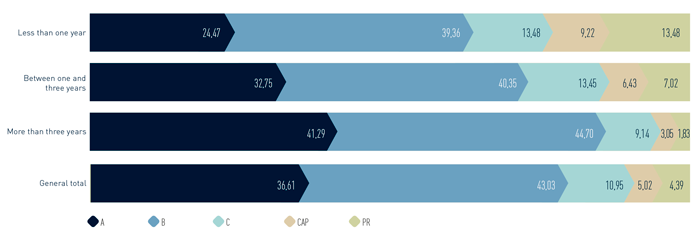
Rating and production volume of suppliers with purchases in 2012*
| Total | 2012 | 2011 | 2012 | 2011 | ||
|---|---|---|---|---|---|---|
|
|
Suppliers | % Suppliers | Suppliers | % Suppliers | % Units | % Units |
| A | 525 | 36.61% | 573 | 38.46% | 20.88% | 26.34% |
| B | 617 | 43.03% | 501 | 33.62% | 70.56% | 61.58% |
| C | 157 | 10.95% | 183 | 12.28% | 6.18% | 6.79% |
| CAP** | 72 | 5.02% | 122 | 8.19% | 1.21% | 3.61% |
| PR | 63 | 4.39% | 111 | 7.45% | 1.17% | 1.69% |
| Total general | 1,434 | 100% | 1,490 | 100% | 100% | 100% |
Rating and production volume of suppliers with purchases in 2012 by geographic area*
| Africa | 2012 | 2011 | 2012 | 2011 | ||
|---|---|---|---|---|---|---|
|
|
Suppliers | % Suppliers | Suppliers | % Suppliers | % Units | % Units |
| A | 77 | 68.75% | 86 | 67.72% | 63.95% | 67.31% |
| B | 24 | 21.43% | 22 | 17.32% | 22.26% | 20.86% |
| C | 4 | 3.57% | 4 | 3.15% | 0.77% | 2.06% |
| CAP | 6 | 5.36% | 8 | 6.30% | 1.95% | 2.30% |
| PR | 1 | 0.89% | 7 | 5.51% | 11.08% | 7.47% |
| General total | 112 | 100% | 127 | 100% | 100% | 100% |
| America | 2012 | 2011 | 2012 | 2011 | ||
|---|---|---|---|---|---|---|
|
|
Suppliers | % Suppliers | Suppliers | % Suppliers | % Units | % Units |
| A | 45 | 66.18% | 47 | 71.21% | 40.10% | 37.67% |
| B | 17 | 25% | 14 | 21.21% | 58.28% | 60.87% |
| C | 1 | 1.47% | 2 | 3.03% | 0.20% | 0.90% |
| CAP | 1 | 1.47% | 0 | 0% | 0.22% | 0% |
| PR | 4 | 5.88% | 3 | 4.55% | 1.19% | 0.56% |
| General total | 68 | 100% | 66 | 100% | 100% | 100% |
| Asia | 2012 | 2011 | 2012 | 2011 | ||
|---|---|---|---|---|---|---|
|
|
Suppliers | % Suppliers | Suppliers | % Suppliers | % Units | % Units |
| A | 142 | 21.13% | 166 | 24.20% | 15.13% | 23.87% |
| B | 338 | 50.30% | 230 | 33.53% | 73.06% | 58.33% |
| C | 109 | 16.22% | 144 | 20.99% | 9.50% | 11.15% |
| CAP | 51 | 7.59% | 79 | 11.52% | 1.82% | 4.76% |
| PR | 32 | 4.76% | 67 | 9.77% | 0.49% | 1.89% |
| General total | 672 | 100% | 686 | 100% | 100% | 100% |
| Non-EU Europe | 2012 | 2011 | 2012 | 2011 | ||
|---|---|---|---|---|---|---|
|
|
Suppliers | % Suppliers | Suppliers | % Suppliers | % Units | % Units |
| A | 29 | 21.32% | 33 | 24.63% | 11.40% | 13.42% |
| B | 78 | 57.35% | 74 | 55.22% | 81.26% | 77.21% |
| C | 19 | 13.97% | 9 | 6.72% | 5.41% | 2.41% |
| CAP | 5 | 3.68% | 11 | 8.21% | 1.05% | 6.68% |
| PR | 5 | 3.68% | 7 | 5.22% | 0.89% | 0.27% |
| General total | 136 | 100% | 134 | 100% | 100% | 100% |
| European Union | 2012 | 2011 | 2012 | 2011 | ||
|---|---|---|---|---|---|---|
|
|
Suppliers | % Suppliers | Suppliers | % Suppliers | % Units | % Units |
| A | 232 | 52.02% | 241 | 50.52% | 24.09% | 26.96% |
| B | 160 | 35.87% | 161 | 33.75% | 72.32% | 68.16% |
| C | 24 | 5.38% | 24 | 5.03% | 2.80% | 2.88% |
| CAP | 9 | 2.02% | 24 | 5.03% | 0.27% | 1.10% |
| PR | 21 | 4.71% | 27 | 5.66% | 0.51% | 0.91% |
| General total | 446 | 100% | 477 | 100% | 100% | 100% |
Classification of the suppliers according to the years of commercial relations with Inditex
Cluster programme1
|
|
2012 | 2011 |
|---|---|---|
| SPAIN2 |
|
|
| Number of suppliers with purchases in the year | 229 | n.a. |
| Number of manufacturers associated with suppliers with purchases | 194 | n.a. |
| Employees who make up the staff of manufacturers that work for Inditex in Spain | 10,394 | n.a. |
| PORTUGAL |
|
|
| Number of suppliers with purchases in the year | 139 | 149 |
| Number of manufacturers associated with suppliers with purchases | 394 | 292 |
| Employees who make up the staff of manufacturers that work for Inditex in Portugal | 20,919 | 15,678 |
| TURKEY | ||
| Number of suppliers with purchases in the year | 136 | 133 |
| Number of manufacturers associated with suppliers with purchases | 374 | 253 |
| Employees who make up the staff of manufacturers that work for Inditex in Turkey | 66,334 | 48,270 |
| INDIA | ||
| Number of suppliers with purchases in the year | 134 | 129 |
| Number of manufacturers associated with suppliers with purchases | 177 | 183 |
| Employees who make up the staff of manufacturers that work for Inditex in India | 64,069 | 54,079 |
| BRAZIL3 | ||
| Number of suppliers with purchases in the year | 59 | 69 |
| Number of manufacturers associated with suppliers with purchases | 182 | 232 |
| Employees who make up the staff of manufacturers that work for Inditex in Brazil | 15,754 | 10,975 |
| BANGLADSH | ||
| Number of suppliers with purchases in the year | 108 | 90 |
| Number of manufacturers associated with suppliers with purchases | 177 | 154 |
| Employees who make up the staff of manufacturers that work for Inditex in Bangladesh | 228,520 | 226,485 |
| MOROCCO | ||
| Number of suppliers with purchases in the year | 96 | 108 |
| Number of manufacturers associated with suppliers with purchases | 158 | 159 |
| Employees who make up the staff of manufacturers that work for Inditex in Morocco | 51,559 | 48,088 |
| CHINA | ||
| Number of suppliers with purchases in the year | 224 | 281 |
| Number of manufacturers associated with suppliers with purchases | 966 | 779 |
| Employees who make up the staff of manufacturers that work for Inditex in China | 170,709 | 168,618 |
| ARGENTINA2,3 | ||
| Number of suppliers with purchases in the year | 53 | n.a. |
| Number of manufacturers associated with suppliers with purchases | 72 | n.a. |
| Employees who make up the staff of manufacturers that work for Inditex in Argentina | 2,046 | n.a. |
Distribution of social investment 20121
| By type of contribution | |||
|---|---|---|---|
| Monetary | €15,372,563 | 72% | % with management costs |
| Time | €579,590 | 3% |
|
| In kind | €5,010,028 | 23% |
|
| Management costs | €383,300 | 2% |
|
| Total | €21,345,481 | 100% |
|
|
By areas of activity 2012 |
|||
| Education and youth | €3,984,523 | 19% | % without management costs |
| Health | €1,726,308 | 8% |
|
| Socioeconomic development | €2,616,704 | 13% |
|
| Environment | €1,062,313 | 5% |
|
| Art and culture | €404,470 | 2% |
|
| Social welfare | €7,544,454 | 36% |
|
| Humanitarian aid | €2,927,857 | 14% |
|
| Other | €695,552 | 3% |
|
| Total | €20,962,181 | 100% |
|
|
Per geographic area |
|||
| Spain | €5,619,039 | 27% | % without management costs |
| Europe (excluding Spain) | €2,717,143 | 13% |
|
| America | €6,543,948 | 27% |
|
| Asia | €3,135,421 | 15% |
|
| Africa | €3,349,713 | 16% |
|
| Global2 | €406,917 | 2% |
|
| Total | €20,962,181 | 100% |
|
for&from data 2012
| for&from Tempe Elche (Alicante) | |
|---|---|
| Sales | 591,343 |
| Store size (m2) | 367 |
| Turnover per m2 | 1,611 |
| Number of employees | 8 |
| for&from Tempe Allariz (Ourense) | |
| Sales | 135,231 |
| Store size (m2) | 65 |
| Turnover per m2 | 2,080 |
| Number of employees | 5 |
| for&from Massimo Dutti Allariz (Ourense) | |
| Sales | 769,533 |
| Store size (m2) | 120 |
| Turnover per m2 | 6,413 |
| Number of employees | 7 |
| for&from Bershka (Palafolls) | |
| Sales | 413,732 |
| Store size (m2) | 80 |
| Turnover per m2 | 5,172 |
| Number of employees | 7 |
| for&from Massimo Dutti (Palafolls) | |
| Sales | 909,450 |
| Store size (m2) | 140 |
| Turnover per m2 | 6,496 |
| Number of employees | 12 |
| for&from Stradivarius (Manresa)* | |
| Sales | 159,215 |
| Store size (m2) | 185 |
| Turnover per m2 | 861 |
| Number of employees | 9 |
Social cash flow
| (millions of Euros) | 2012 financial year |
2011 financial year |
|---|---|---|
| Net cash received for sale of products and services | 15,946 | 13,793 |
| Cash flow received from financial investments | 24 | 30 |
| Cash received for sales of assets | 0 | 0 |
| Total value-added cash flow | 15,970 | 13,823 |
| Distribution of value-added cash flow |
|
|
| Employee wages | 2,548 | 2,234 |
| Tax payments | 818 | 693 |
| Financial debt return | -5 | 36 |
| Dividends paid out to shareholders | 1,130 | 1,004 |
| Corporate social investment | 21 | 13 |
| Cash withheld for future growth | 394 | 19 |
| Payments outside the Group for purchasing goods, raw materials and services | 9,725 | 8,475 |
| Payments for investment in new productive assets | 1,339 | 1,349 |
| Total distribution of value-added cash flow | 15,970 | 13,823 |
Capitals balance sheet
| Capitals | Challanges |
|---|---|
| Human capital |
|
| Intellectual capital |
|
| Financial capital |
|
| Social and Relationship capital |
|
| Manufactured capital |
|
| Natural capital |
|